





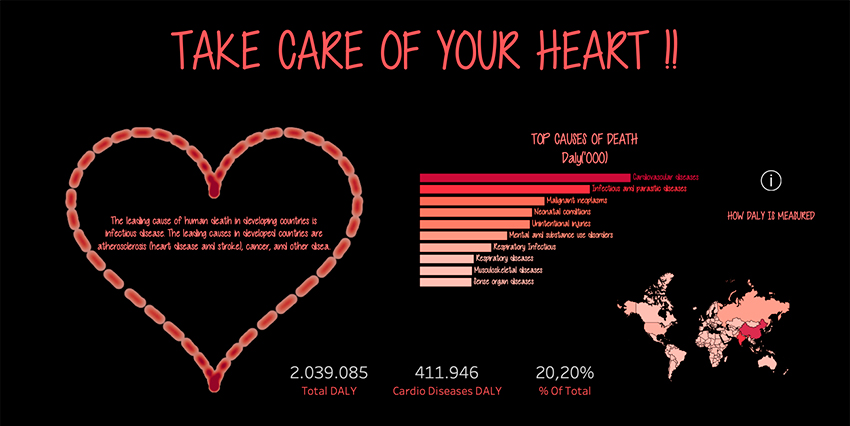
-
23/05/2019
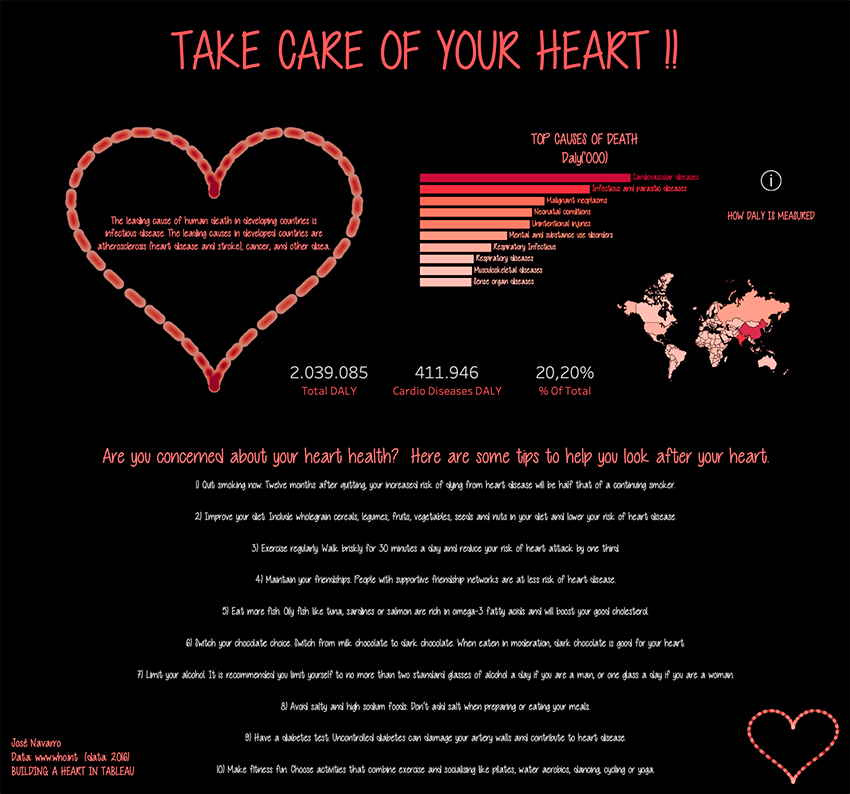
How to create a Chart in the shape of a heart like the one used in this visualization:
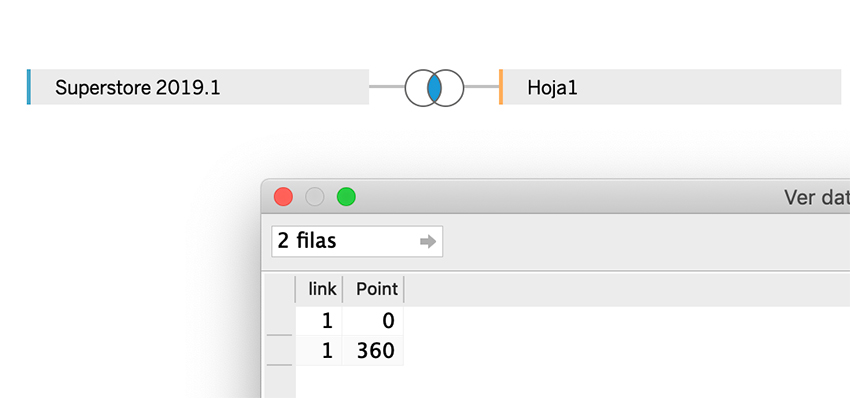
We are going to use the DataSet SuperStore and a template that we will use to create Densification. (Creating virtual marks with a Bin)
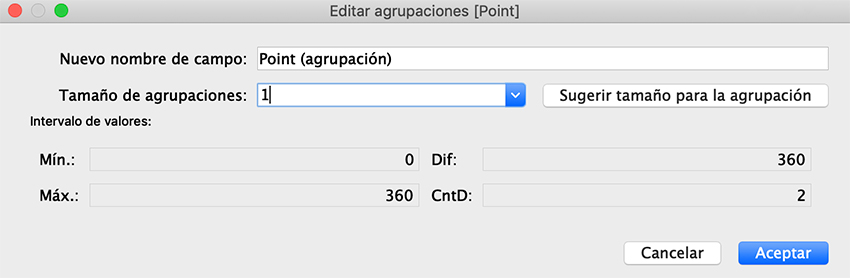
We create the Bin with size = 1
Next, we create the calculated field Index, which will be computed using the previous Bin
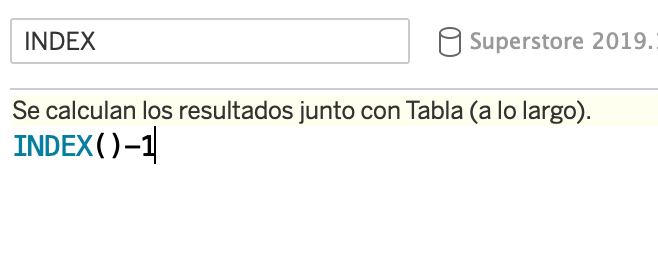
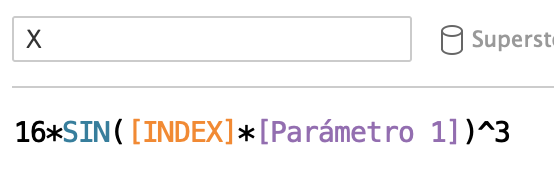
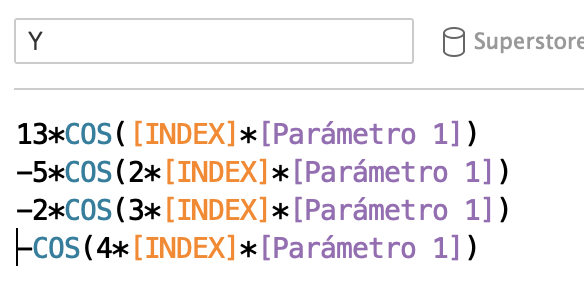
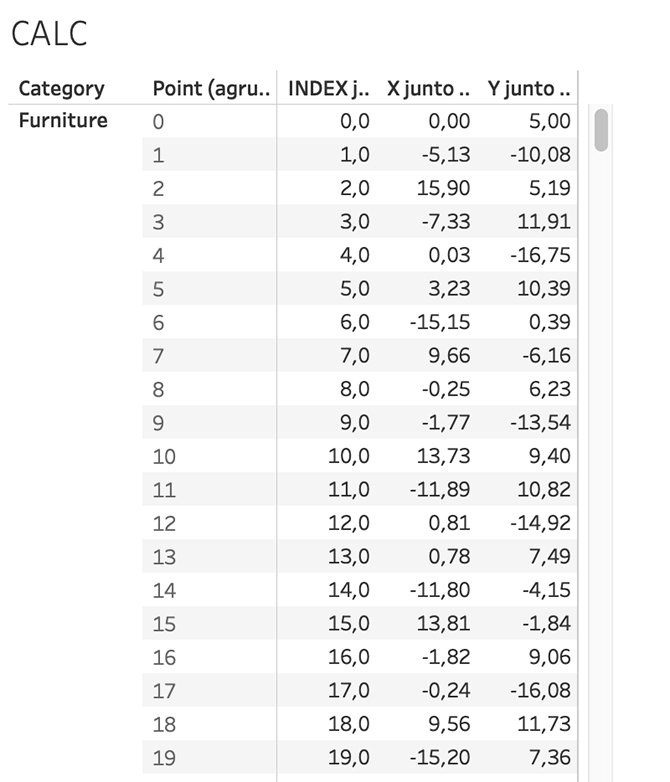
We create the calculated fields X and Y, which give us each point of the heart. We use a parameter to be able to adjust the shape of the Heart. Both X and Y will be calculated using the bin
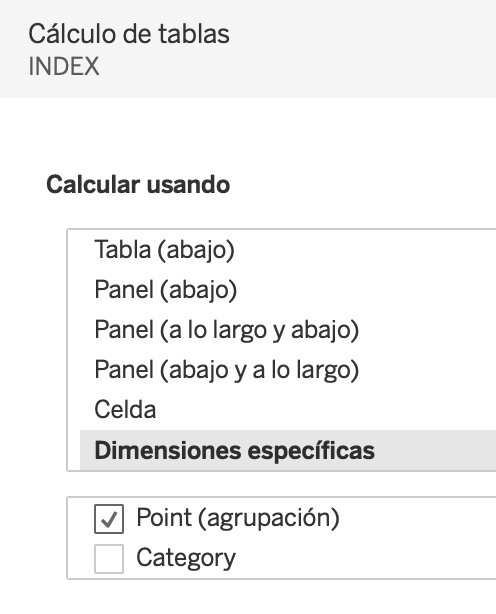
Review the Table Calculations
- INDEX, X AND Y computed using the BIN
At this point, we would have this table of data:
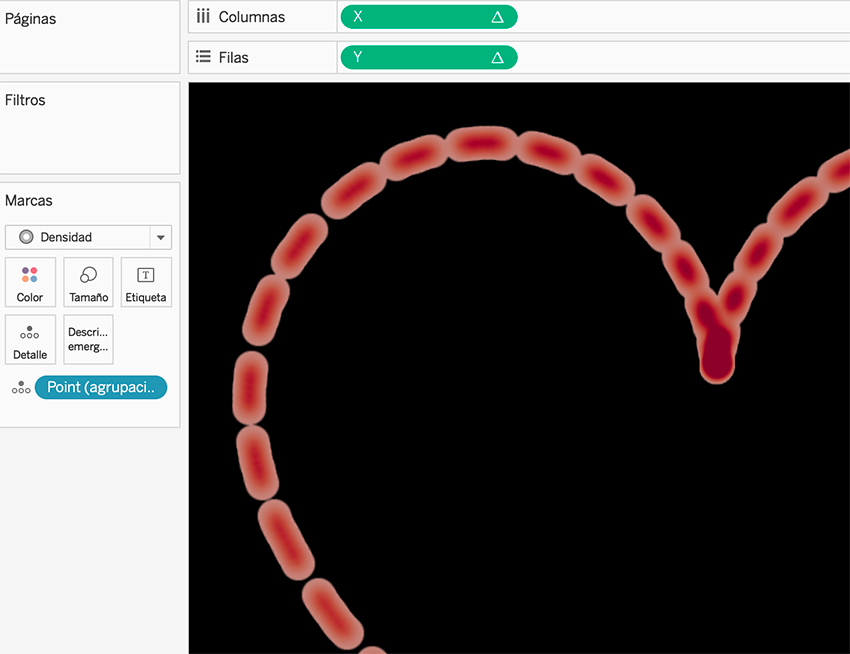
Now, we build the visualisation
- X to Colmuns
- Y to Rows
- Type of Mark Density
- Bin (Point) to Detail
and format according to your preferences!
That’s all and Cheers!!