






-
19/06/2019
Let’s build this time the Mekko Chart using SuperStore to visualize the % of Total Sales for each Category using 2 dimensions, Subcategory and ShipMode
First of All, we calculate the Sales for each Ship Mode with 4 Calculated Fields:
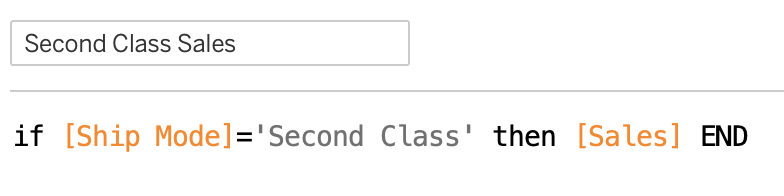
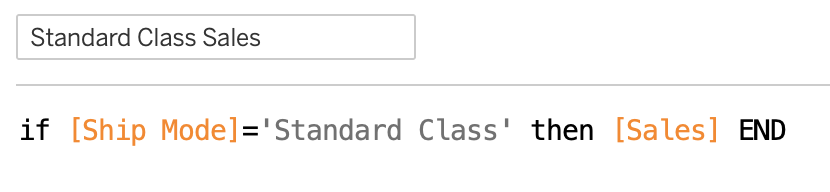
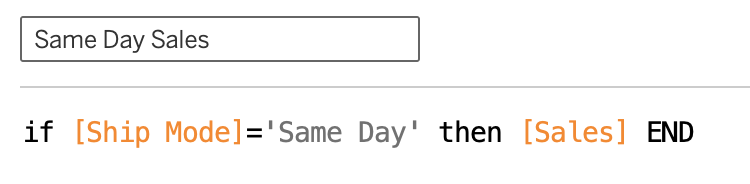
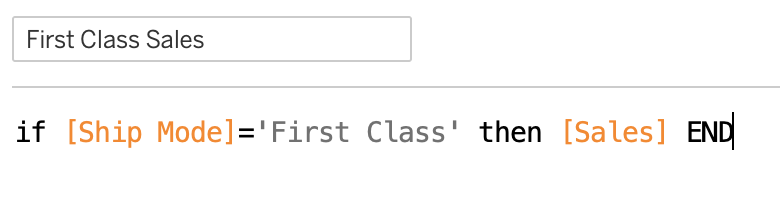
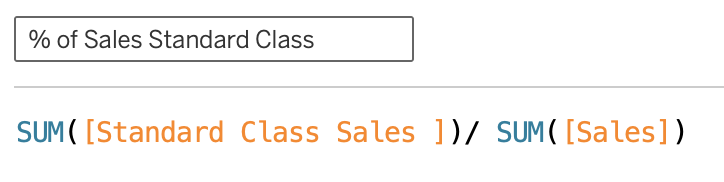
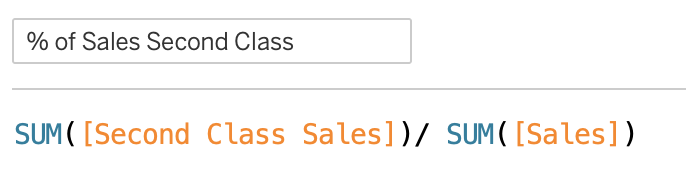
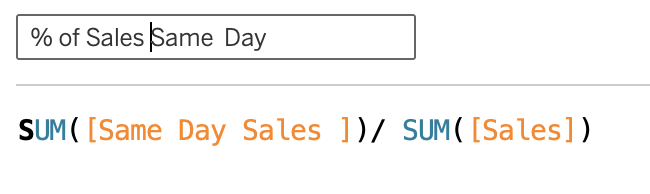
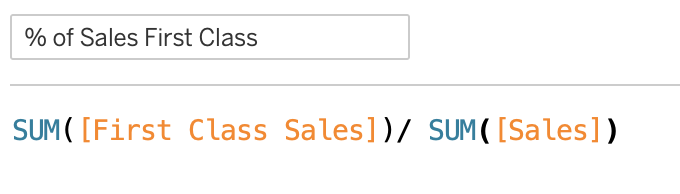
Then we calculate the % of Sales for each ShipMode, with 4 new Calculated Fields:
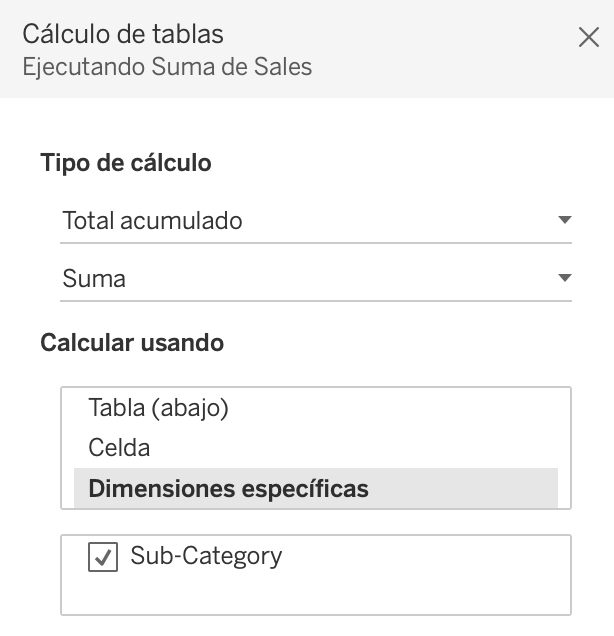
We also need to use SUM(Sales) with the Table Calculation Running Sum, computed using Subcategory:
Drag the las 5 last calculated measures to the view and drag Subcategory to Rows. At this point you should have something like this:

Duplicate the view and start building the Chart:
- RunningSum of Sum(Sales) to Columns
- Measure Values to Rows and Label
- Measure Names to Color
- Subcategory to Detail
- Type of Mark Bar
- SUM(Sales) to Size
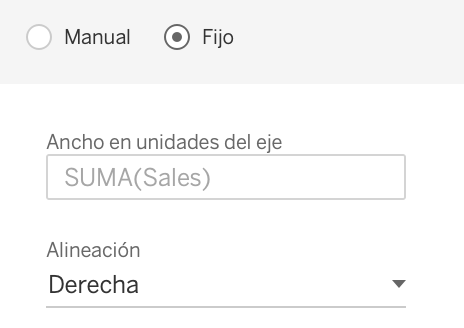
Click to Size and select the fixed option, with Right Alignment:
Then Format the view as your preference!

Thanks’ All and Cheers!